XbarR, XbarS, Individuals, n, p, u, and np Charts. Update charts after they’ve been created. Identify outliers and have them displayed without affecting the control limiits.
Measurement System Analysis (Gage R&R) for both Quantitative and Binomial Data, Cause and Effect Diagram, Main Effects Plots, Cusum, Product Capability, FMEA, and Distribution Calculators.
Excel Integration
SPC XL integrates into Excel, streamlining your workflow and saving you time.
Microsoft Excel Integration
SPC XL integrates into Excel to speedup your data analysis workflow. Instead of copy and pasting your data into another application, with SPC XL you can store, analyze, and present your results within Excel.
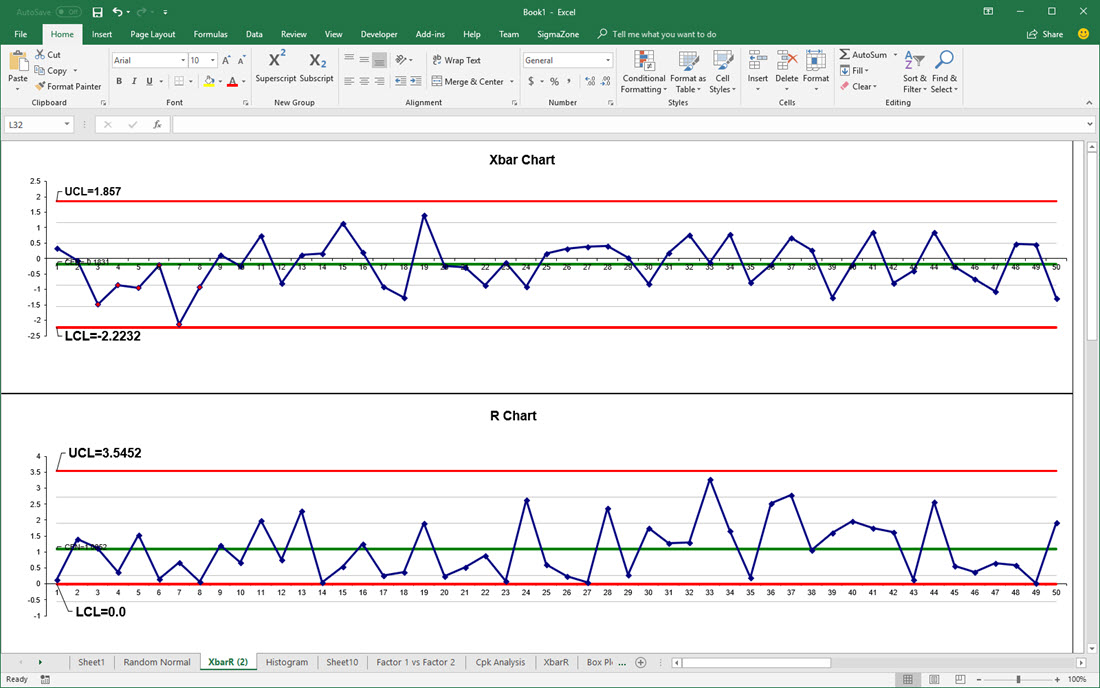
Control Chart Features
Control Chart Wizard to help you pick and start the optimal chart
Update control charts without recreating them
Mark outliers which are still plotted but do not affect control limits
Cpk and Ppk analysis optionally created with Control Charts
Available Control Charts
XbarR Chart
Xbar S Chart
Individuals Moving Range Chart
n Chart
p Chart
np Chart
u Chart
Analysis Diagrams Features
Diagram Selection Wizard to help you pick the best diagram


Reviews
There are no reviews yet.